Breaking the ice point: North Korea’s earthquake employment data is hard to beat the gold riot
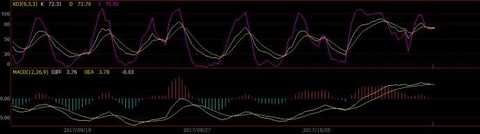
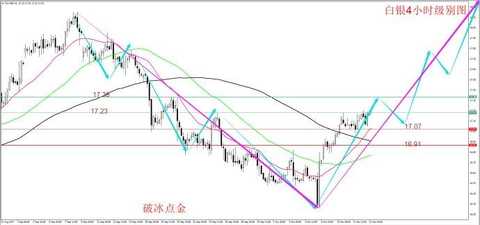
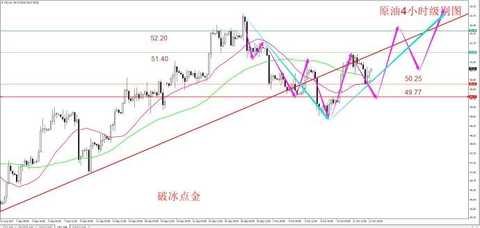
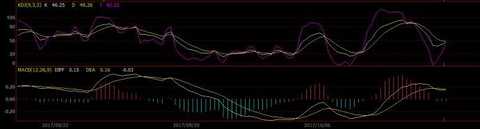
This week, the last trading day, the data of the overnight is also very exciting. On the one hand, the US initial jobless claims have reached a new low, which fits the previous non-agricultural data. After the announcement, the dollar rebounded slightly and the upward trend of gold was also suppressed. At the same time, the US PP rate in September also increased strongly. As far as yesterday's data is concerned, it seems that all the spearheads are pointing to the decline of gold, but this morning the US Geological Survey once again reported that there was a magnitude 2.9 earthquake in North Korea, and it is difficult to tell whether it is artificial or natural. The news is once again out of the market, the market is This is very sensitive. Most people think that the probability of North Korea testing again is very high, so the US dollar fell again, and gold once again ushered in a rising opportunity. In terms of basic information analysis, Breaking Ice believes that the probability of gold continuing to rise in the later period is relatively high, and it will still be dominated by long positions in the future. Therefore, we must firmly hold the 1262, 1270, and 1274 lines in the low position. Don't give up, even if there is a retracement, it is still a bullish trend. Fundamental news: The overnight gold gain was mainly suppressed by US data. From the United States to October 7th, the number of jobless claims in the first week of the week recorded 243,000, a new low of more than a month, which was the second consecutive week of decline in October, indicating that the overall health of the US labor market is healthy. It is believed to support the probability of raising interest rates. At the same time, the US PPI data released in September showed that the US PPI increased by 0.4% in September, the largest increase in five months; the US PPI increased by 2.6% in September, the largest increase since February 2012. In addition, geopolitical tensions are still supporting gold prices. The US Geological Survey reported that an earthquake measuring 2.9 on the Richter scale occurred 23 kilometers northeast of Sungjibaegam in the early morning of Friday, when the location of the earthquake was close to where the nuclear test was conducted. Although the initial report showed that the earthquake was not caused by a nuclear test, the US Geological Survey said it could not determine whether the earthquake occurred naturally or artificially. Oil prices on Thursday were mainly affected by institutional monthly reports and US inventory weekly data. The pessimistic expectations of the previously announced OPEC monthly report and EIA short-term energy outlook report are still suppressing oil prices. After the early morning API report showed that the US crude oil inventories unexpectedly increased, the US and the two oils began to expand. Although the IEA monthly report for the day is expected to reduce oil inventories in 2018, this news will not help the oil price reverse the decline. The EIA data released in the evening favored the positive, once the oil price climbed, but then the oil price plummeted again, and then continued to narrow the decline. After the EIA crude oil inventory report was released in the evening, the oil price began to return to blood. At 23:00 on Thursday, EIA announced that crude oil inventories recorded a decrease of 2.747 million barrels in the week ended October 6, which recorded a decline for three consecutive weeks. Crude oil production also recorded a decline for the first time after four consecutive weeks of growth. After the release of EIA data, the US oil cloth oil was short-term. On October 12, the gold re-accepted Xiaoyang line. It opened at around 1291.80 in the morning and closed at around 1293.30. The highest hit in the session was at 1297.30, and the lowest was down to 1289.40. After the opening of gold in the morning, the market began to fluctuate upwards, and near the apex of the Asian market, after the opening of the European market, gold hit an intraday high of 1297.30 and began to oscillate. After the opening of the US session, gold began to pull back, creating a low intraday low. After the wave of 1289.40, it began to rebound. The US market continued to fluctuate so far. In general, the trend of gold yesterday was the Asian market, the European market fell, and the US market bottomed out. The ETF's position remained unchanged from the previous level, and has remained unchanged at 858.45 tons since October 9. The gold 4-hour cycle is currently in an upward trend. From the K line, gold has a clear stop-up signal in the form, and the market is back in the 1290 platform with a sharp correction. The K-line forms a positive near the 1285 round of the previous round of callbacks. The form of swallowing the yin, and then the market has been going all the way up to now. As a whole, the market is still a bullish trend in terms of form, but it needs to be guarded against yesterday's hourly level unilateral rise is a confirmation for the 1285 rise, if confirmed, the bulls will make a short position. . In the theory of the K-line game, the current trend of gold is stronger than the Yin column, and it is still in the bull market. However, after the two negative columns of this callback appear, the rising Zhongyang line does not appear to be swallowed. Then we think that this kind of action is more biased towards the end of the staged multi-head. On the moving average, the gold trend is still in the bullish trend, the directionality of the moving average is still strong bulls, and the short-term moving averages below as a support all the way up, and in this rising market, the market is relying on 20MA all the way up. Then we can think that the upward trend since 1260 does not break the current 20MA1290 line and continue to maintain a long-term idea until the K line confirms to wear the 20MA position. On the moving average, you need to do this. In terms of indicators, the current trend of KDJ rebounds rapidly from the bottom, and there is a secondary passivation down the head around 100. It is obvious that the success of KDJ secondary passivation requires the K line to exceed the previous high to confirm. On the MACD, the fast-track starts to turn into a dead fork, and the kinetic energy red column enters the decay phase after a small increase. The long-term kinetic energy needs new support to rise. Then it is clear that gold's kinetic energy has become more confusing at this stage. Similar to the round of the 1280 late decline on the large structure, the indicator is more chaotic and the structure becomes blurred. In this case, the gold is either to be changed. Either it is going to rise again, because we know that shocks mean that unilateral movements are about to appear. In general, the current trend of gold is not clear enough. We hope that we will see the trend in the later period and confirm the trend-based theory. Continue to keep the bullish thinking unchanged until the uptrend line is broken. Operational recommendations Gold continues to rely on the 1290 first-line support below. The 4-hour cycle of silver is currently in an upward trend. On the K-line, silver has regained its bullish pattern in the evening yesterday. From the perspective of the K-line game, the K line from 16.3 is closed at 2 am. The big Yang line is to verify the behavior of the bulls in the dominant market, so we believe that the overall dynamic is still in the bullish trend. So in the uptrend we have been following the trend so far, then it is clear that any callback in the trend is a bullish opportunity, let alone a bullish pattern. On the moving average, silver has been rising along the 10MA. The current position is still within the control range of 10MA, while the lower mid-term line 20MA is the rising point of yesterday night. From the perspective of the moving average, the late silver trend is not broken. Low thinking is unchanged. The indicator follows the trend of gold. KDJ is passivated several times in the middle position, and the high position is passivated. Therefore, the probability of still seeing more in the later period is greater, but often the rise is only the last passivation with big action. The MACD has already begun to turn heads down. In general, silver has once again received more short signals, but in the past few days, there have been short signals every day and the market has been rising, which proves that it is in extreme market, then we need to consider Before the end of the rising structure is determined, follow the trend theory and do all the way to break the position! The 4-hour cycle of crude oil is currently in a pullback trend on the large structure. It is clear that the current performance on the market is a very clear large structure rise, but in the small structure is currently retracing, from the K line, yesterday After the crude oil experienced a sharp decline in the evening, it was quickly recovered. However, this kind of counter-pumping is based on the case of EIA data, so we believe that the rebound under the data blessing is not very high, which means that the bulls are generally unfavorable. Will this opportunity to operate, but in fact did not happen, then our analysis of market sentiment that the crude oil is still not in place, then the K line on the top of the line to construct a double structure apex, and on the evening of October 11 At the beginning of the 22:00 line, the three K lines received empty square guns, so it is clear that the short momentum is currently very strong. From the point of view of the K-line game, the Dayang line is the main tone since 49.1. However, the third line of the current Yinxian line is still not swallowed up, and a deeper correction is needed later. On the moving average, the current moving average indicator is in the entanglement stage, and the multiple moving averages cross over several times, so the volatility trend is formed on the moving average. At present, the short range of the volatility range has not yet reached the target, and there is still the possibility of continued decline in the later stage. In terms of indicators, KDJ's current trend is starting to rebound at a low level. In the recent KDJ, the probability of a low rebound is a high probability. This is a point that needs our attention. On the MACD, it happens to be the opposite. The fast line is slow. The high position begins to turn head down to form a dead fork, and at the same time the formation of the dead fork, the kinetic energy red column ends with a successful green column, indicating that the intervention of the short kinetic energy is very obvious, then there is a deviation between KDJ and MACD, based on the inertia of MACD, we prefer MACD. The inertia effect. Generally speaking, according to the current trend, the structure is an upward trend, and the current structure of the decline is still not fully realized. Therefore, the operation of crude oil is still the idea of ​​longing after the short position. The intraday operation is short, and after the short position is realized. Do more on dips. Taken together, the operating gold in the day considers the priority to follow the trend low, with the support below 1290, 1284, 1277 and the upper resistance at 1297, 1305, 1313. The trend of silver continued to be lower with gold, with support at 17.07, 16.91 and 16.75, and upper resistance at 17.23, 17.38 and 17.59. The crude oil market is considered to be more empty after the day, with support below 50.25, 49.77, 49.13 and upper resistance at 51.40 and 52.20. Breaking the ice point of the sixteen-character policy: cash for the emperor's position as the emperor's point for the stop loss to the holy Here you can find the related products in Beanie Hat, we are professional manufacturer of Beanie hat. We focused on international export product development, production and sales. We have improved quality control processes of Beanie Hat to ensure each export qualified product. Knit Hat,Knit Bucket Hat,Knit Beanie,Knit Cap Tonglu Linghui Import and Export Trading Co., LTD , https://www.hzlinghui.com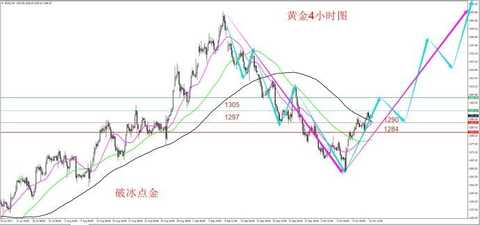
If you want to know more about the products in Beanie Hat, please click the product details to view parameters, models, pictures, prices and other information about Beanie Hat.
Whatever you are a group or individual, we will do our best to provide you with accurate and comprehensive message about Beanie Hat!